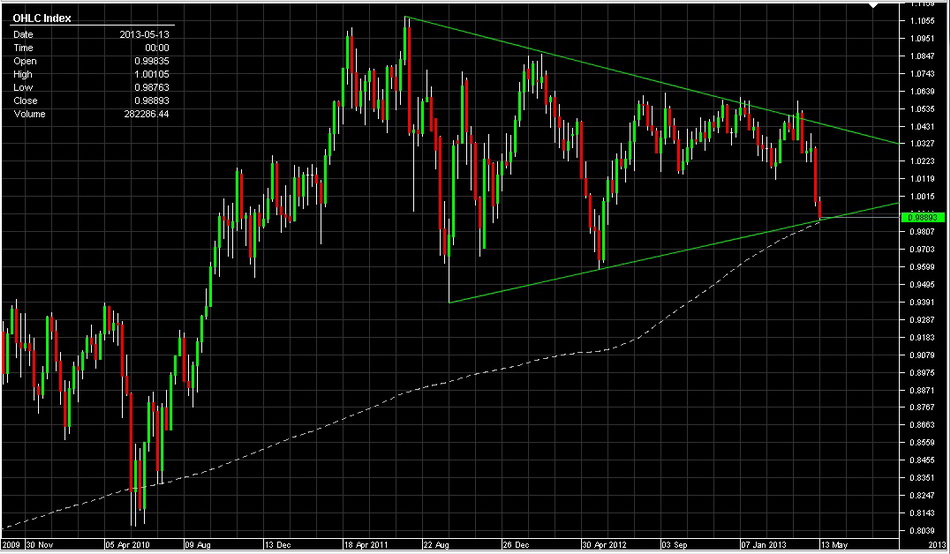
AUD/USD
|
Wednesday 2013-05-15 14:15:34
|
|
hit the level around 0.9870/80 after the daily close below parity. It's now at around an important support. 0.9856 is 200WMA. It's also close to the bottom of the long term triangle(see the chart below). Breaking this level should be a real deal of the start of the long term downtrend of this pair. I expect it will break this level either sooner or later. The scenario now is to sell the rally. Watch the 1.0114/50 level for the resistance which was the important support. It now turns resistance. If it move right back above this resistance, don't short it.
|
|
|
Back to Top
|
Disclaimer: The information in this content represents my own opinions, knowledge, and experience that I’ve learnt and been through. So in sharing this information is to help you with ideas to include in your research before making a decision to either trading or stepping into this part of investment. Please read the full Risk Disclaimer in the term and condition section. |
|
|
