AUD/USD
|
Tuesday 2012-09-25 09:11:26
|
As of the previous analysis of AUD/USD, my short was hit only at my first target at 1.0107 and it couldn't break this support to my second target at parity. After that the price moved back up and broke the 61.8 Fib resistance at 1.0369 but it still couldn't break a year long downtrend line since July 27th, 2011, a record high, and created a lower high at around 1.0613 and then dropped again around 435 pips to 1.0160. Then the price went up again from the better unemployment rate plus the launched of the QE3 from Mr. Ben
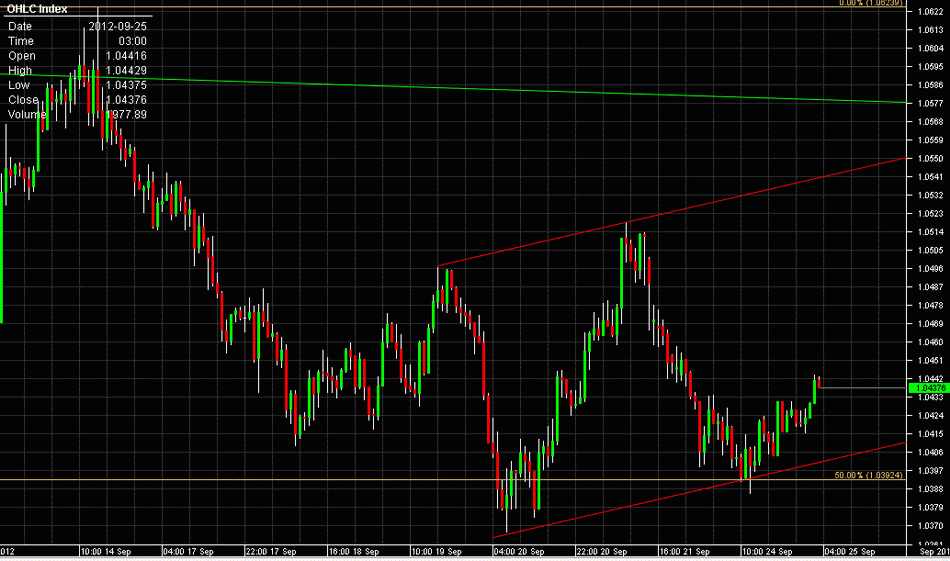
However, the price went to 1.0624 and broke the year long downtrend line (the green line, click the link below to see the chart) which came at around 1.0595 and it couldn't close above this trend line and went right back below it creating a shooting star candle on a daily chart. This is also a wash and rinse of the previous high of 1.0613. From this technical point of view, you could still trade in a short side against this year long downward trend line which now comes at around 1.0580 and have a stop above this line or the high at 1.0624. You should wait for a better entry though as of now the price is at around the middle of the range between 1.0160 and 1.0624 at the time of writing. This is for the bear side.
If you are a bull, you can long against the 61.8 Fib support of 1.0160 low to 1.0624 high which comes at 1.0337 or the Sep 11th, 2012 low at around 1.0320 these are your stop loss. The target is around that year long trend line around 1.0560. If it breaks 1.0560 then the next target is 1.0600 or the high at 1.0624.
On an hourly chart, I see that it creating an upward channel (red channel line on the chart below), You can also trade with this channel. As for bull now the price is at around the bottom line of the channel so you can long by having a stop below this channel or below the previous low at 1.0367. And for bear you can short when the price hits the upper line of this channel. Stop could be above 1.0580 or 1.0624.
If it breaks this channel to the down side it can come to the head and shoulder pattern that I see on 4 hour chart that now seems unlikely to happen. Anyway the first target is around 1.0320 if it happens. And if the bear is strong, it can test the low at 1.0160
I have the feeling that the price should range between around 1.0600 and 1.0320 for now. As of the fundamental side people still confuse whether the QE3 would work or not.
For me, my bias is still to the down side. I don't think this QE3 will have much effect this time. Plus it's the China economic slowdown and the tension between China and Japan about the disputed islands, the crisis in Europe and so on. And from many experts that I've read, they're also so negative with this QE3. Wish you all have successful trades. Hope this analysis can help.
|
|
|
Back to Top
|
Disclaimer: The information in this content represents my own opinions, knowledge, and experience that I’ve learnt and been through. So in sharing this information is to help you with ideas to include in your research before making a decision to either trading or stepping into this part of investment. Please read the full Risk Disclaimer in the term and condition section. |
|
|
